UE5 stat unit explained: finding bottlenecks and keeping performance stats visible
Learn to compare Frame, Game, Draw, GPU, and RHIT timings, retain statistics in the editor, and display them in a running app. The article also includes an explicitly identified AI research section on profiling and optimization.
Note: This article is more than one year old.
- Interpretation of console statistics such as
stat unitdepends on the rendering path, including Deferred and Lumen. Check the explanation for your version.- What counts as a good threshold depends on project scale and target FPS. This article gives introductory guidelines.
- Use a profiler such as Unreal Insights alongside these statistics when identifying bottlenecks.
When UE5 stutters, first investigate what is causing the load
This article explains the stat unit fields, basic bottleneck identification from those statistics, and how to display them automatically each time.
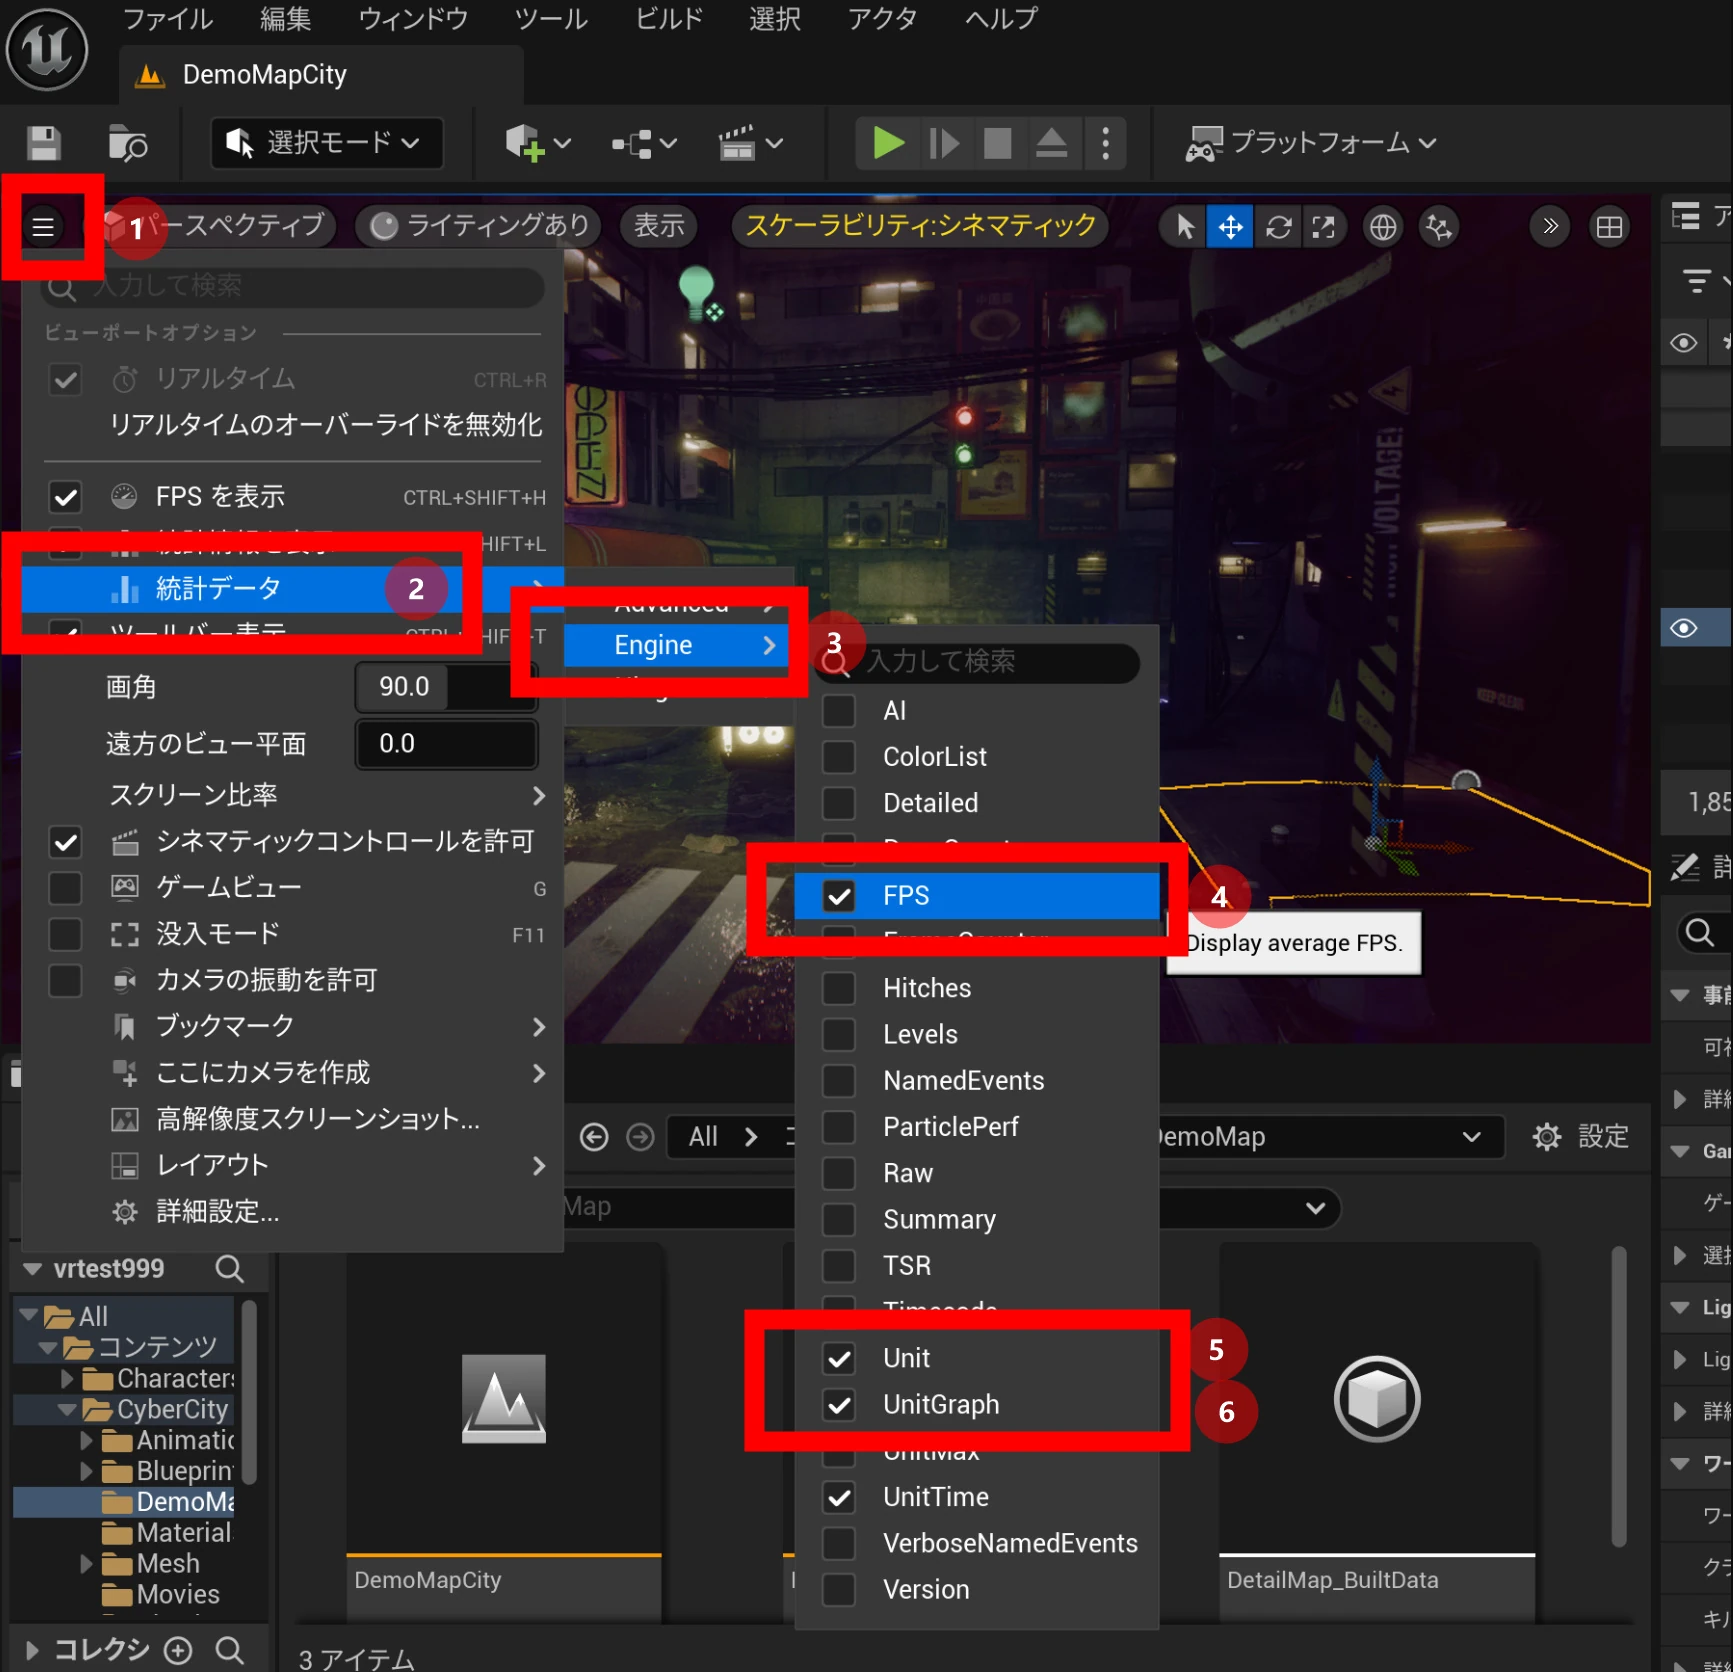
Statistics such as stat unit are the first step in investigating performance. You can type stat unit into the console, or use the viewport menu: 1. Click the upper-left menu; 2. choose Stats; 3. Engine; 4. enable FPS; and 5. enable Unit and UnitGraph. Use whichever method is easier.
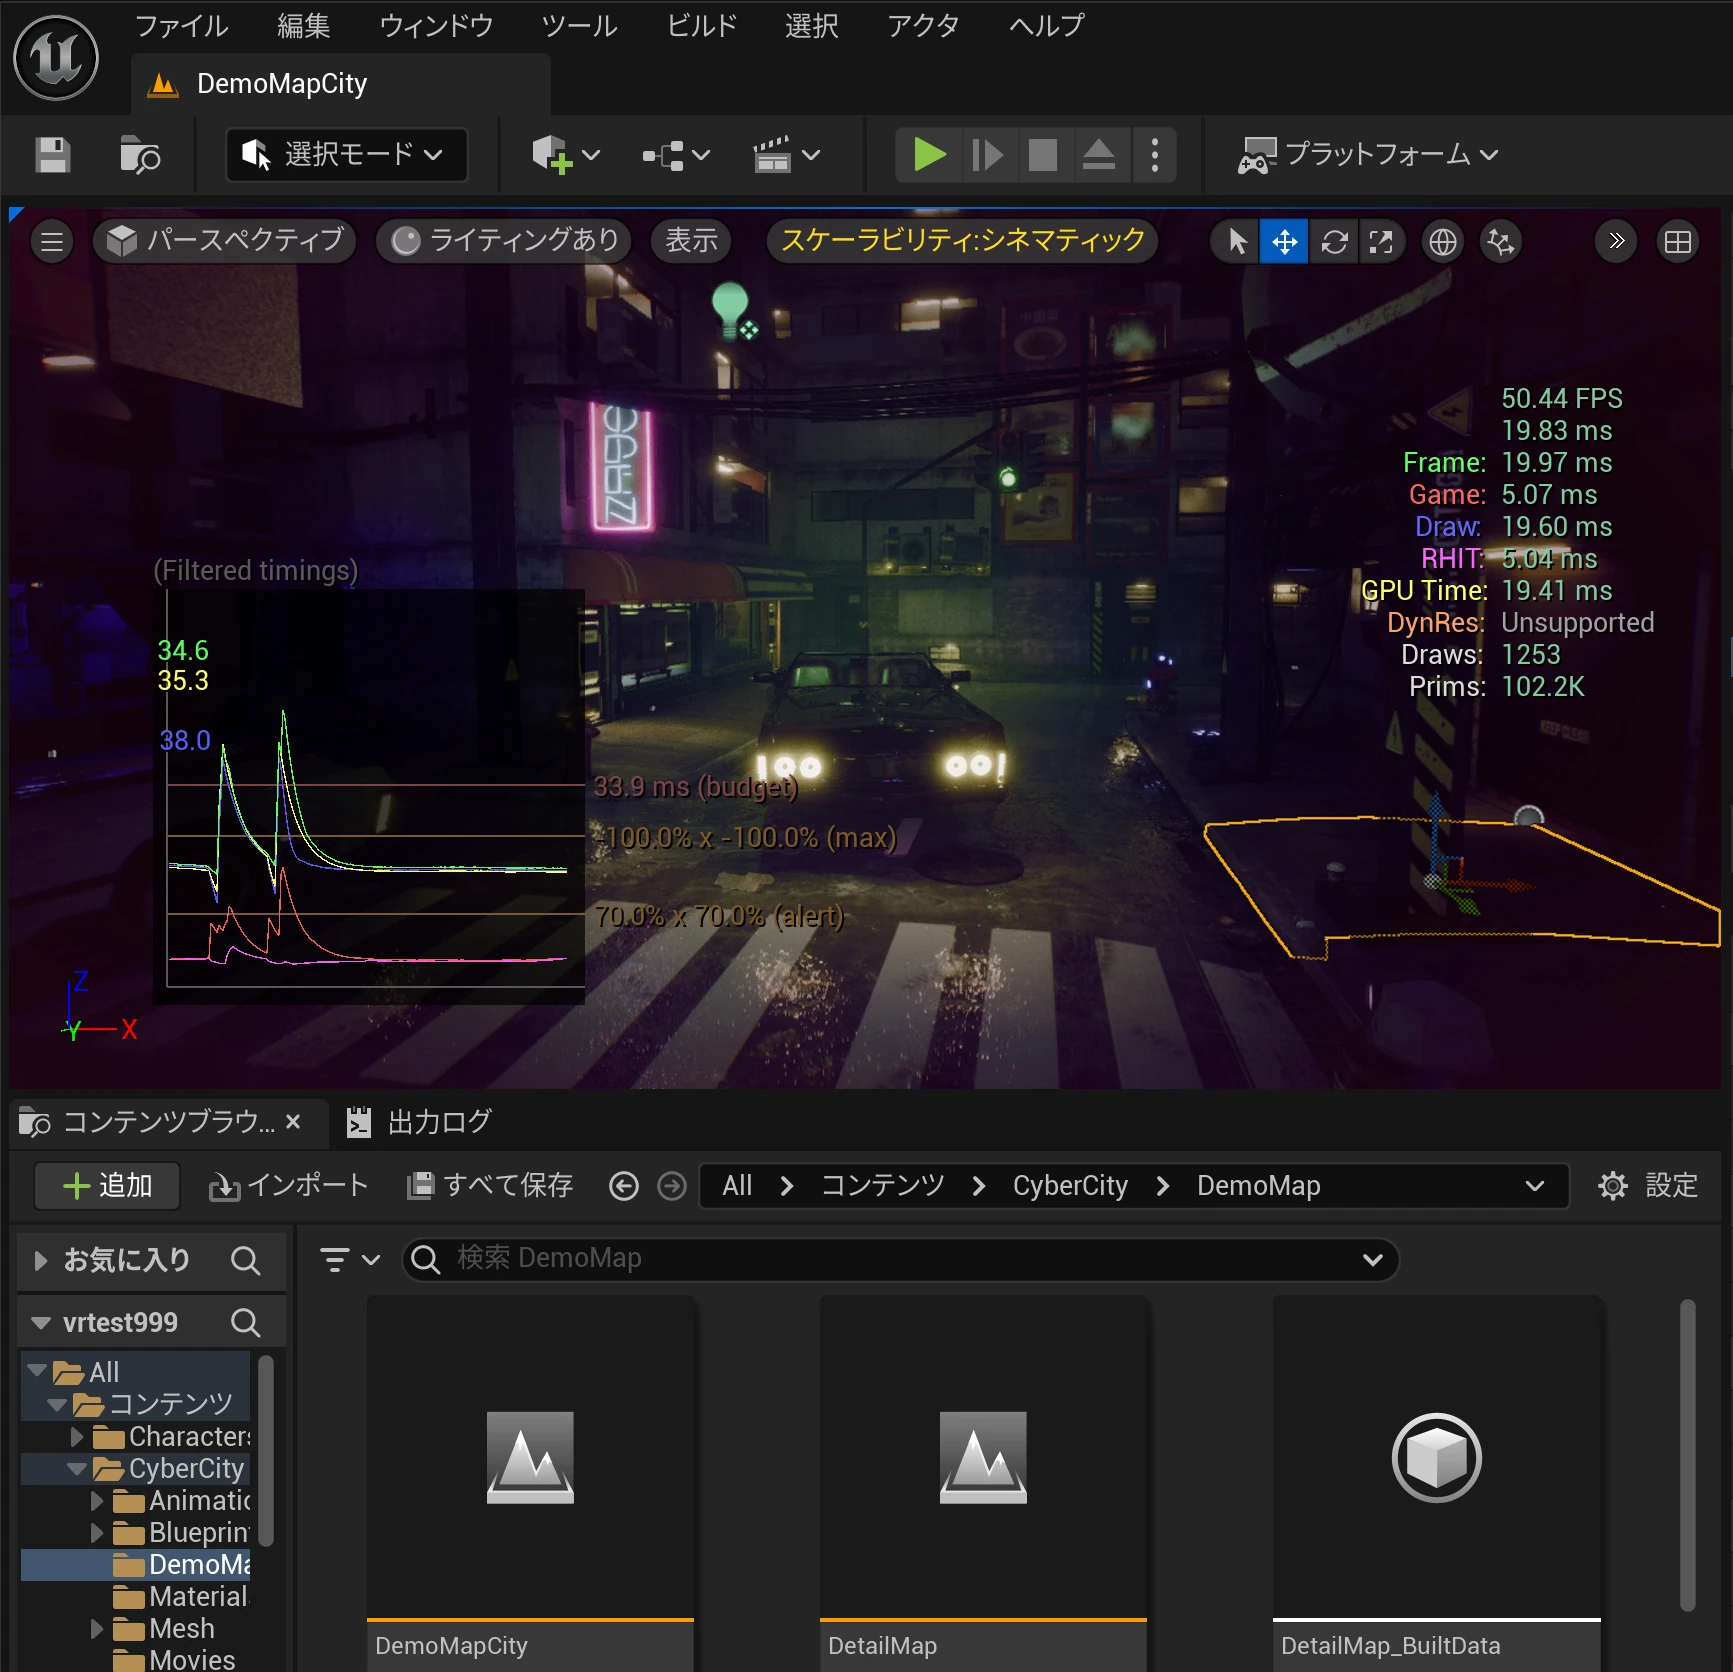
 Detailed numbers appear on the right, including Frame, Game, Draw, RHIT, GPU time, DynRes, Draws, and Prims.
These help identify whether performance is limited by the game thread, which handles logic and player input; the rendering thread, which handles rendering preparation, textures, shaders, and lights; or the GPU.
Official explanation:
Frame
Frame time is the total time needed to produce one frame. Because the game and rendering threads synchronize before a frame finishes, it is often close to one of those thread timings.
Game
If Frame is close to Game, performance is probably bottlenecked by the game thread.
Draw
If Frame is close to Draw, performance is probably limited by the rendering thread.
GPU time
Measures how long the graphics card takes to render the scene. GPU time is synchronized with the frame and can therefore be similar to Frame.
RHIT
RHI thread time is synchronized with the frame and may also be similar to Frame.
DynRes
When supported and enabled, dynamic resolution displays the primary screen percentage together with the secondary screen percentage.
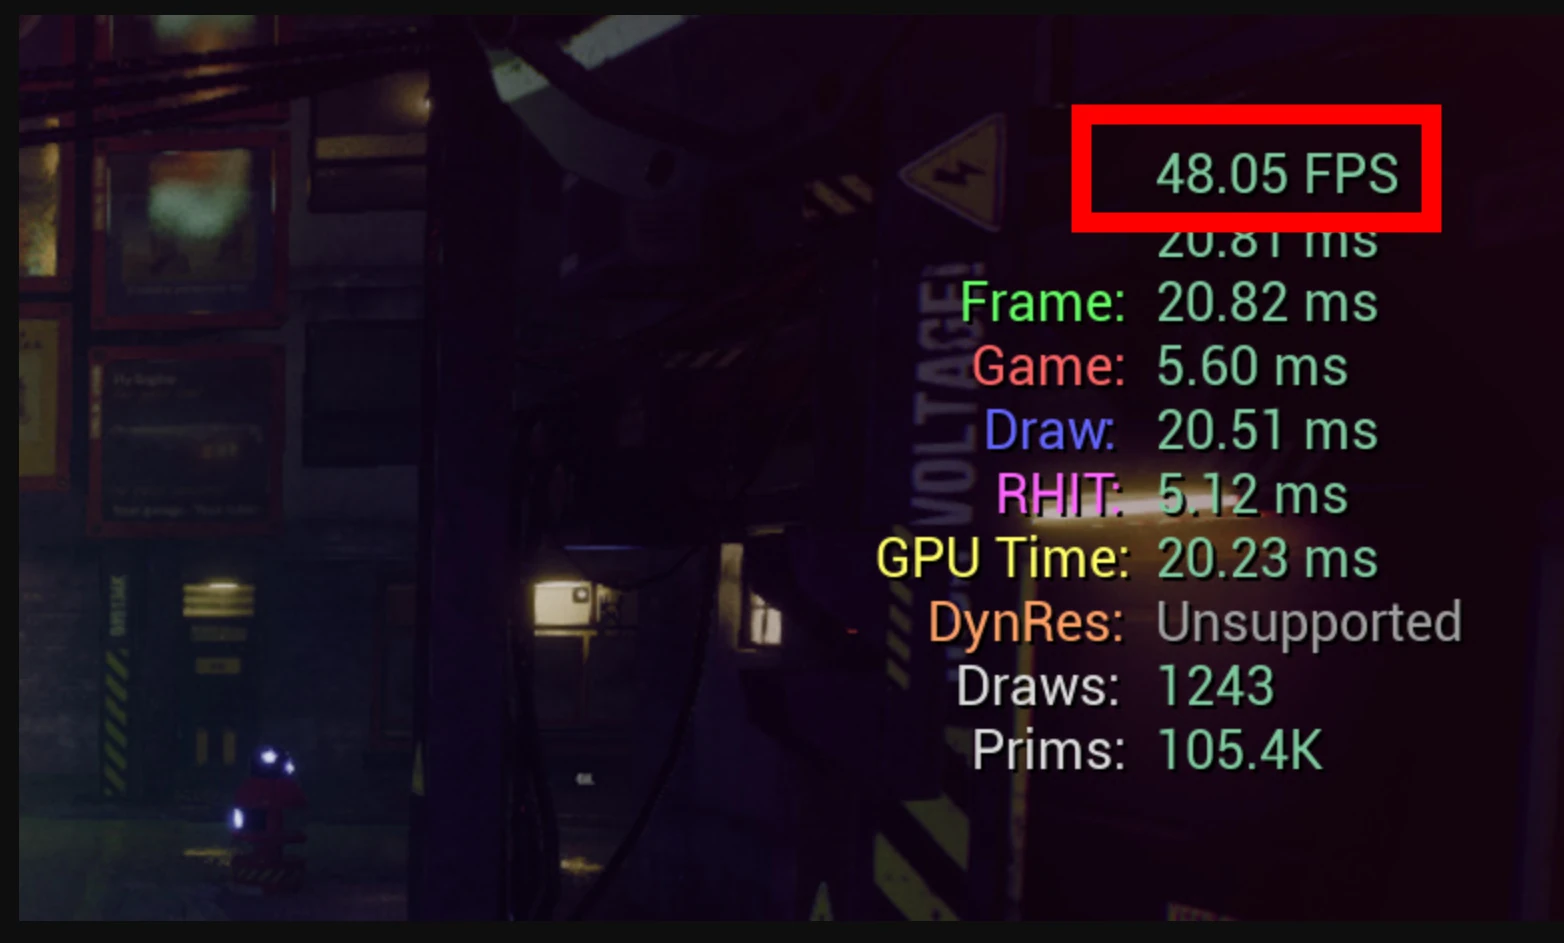
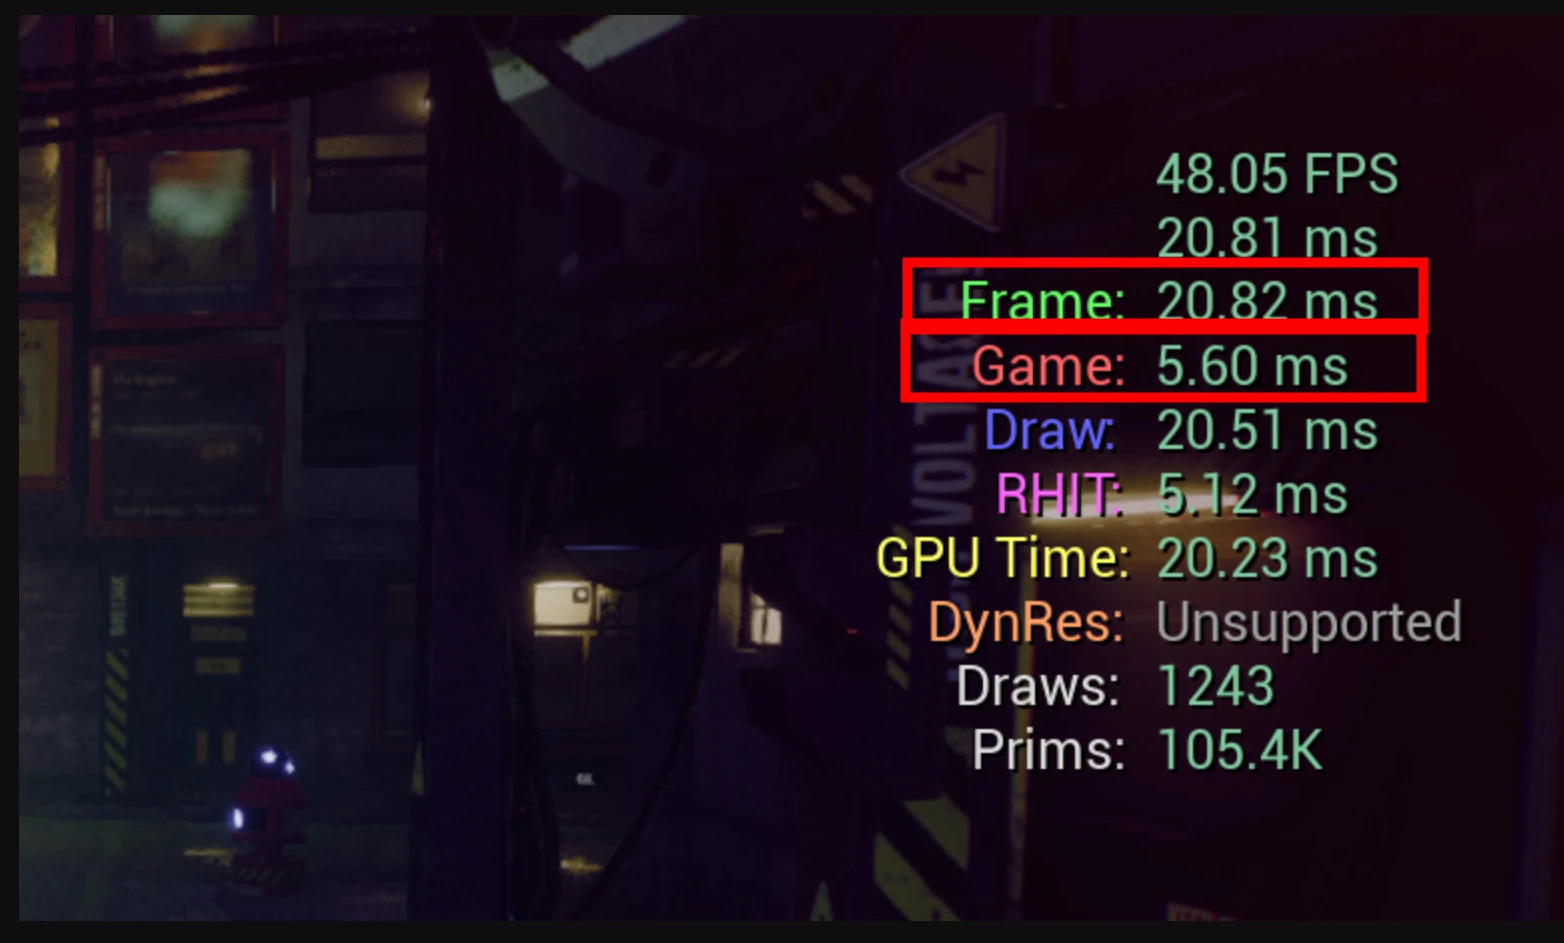
The top number in the following image is this project's actual FPS. It should reach 60FPS, but a bottleneck is holding it to 48FPS. What is limiting it?
First, compare Frame and the game thread
When Frame is close to Game, the game thread is likely to be the bottleneck. This thread handles game logic, AI calculations, physics, and similar work. If it accounts for much of the frame time, that work needs optimization.
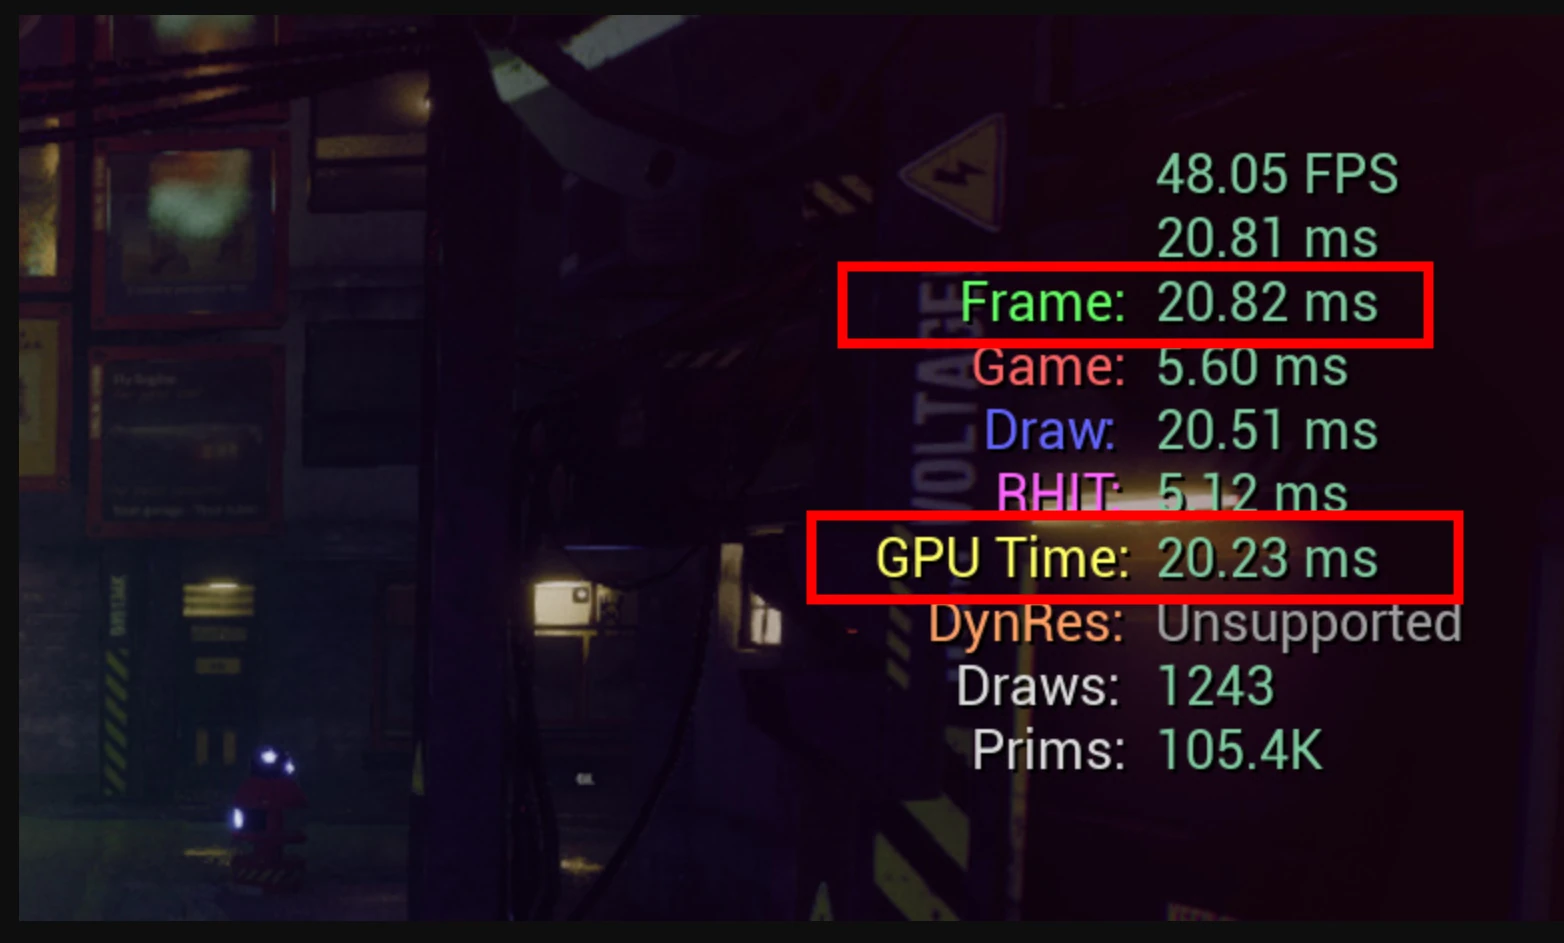
In the example below, Frame and Game are not close, so I concluded that the game thread was not the bottleneck.
Compare Frame and the rendering thread
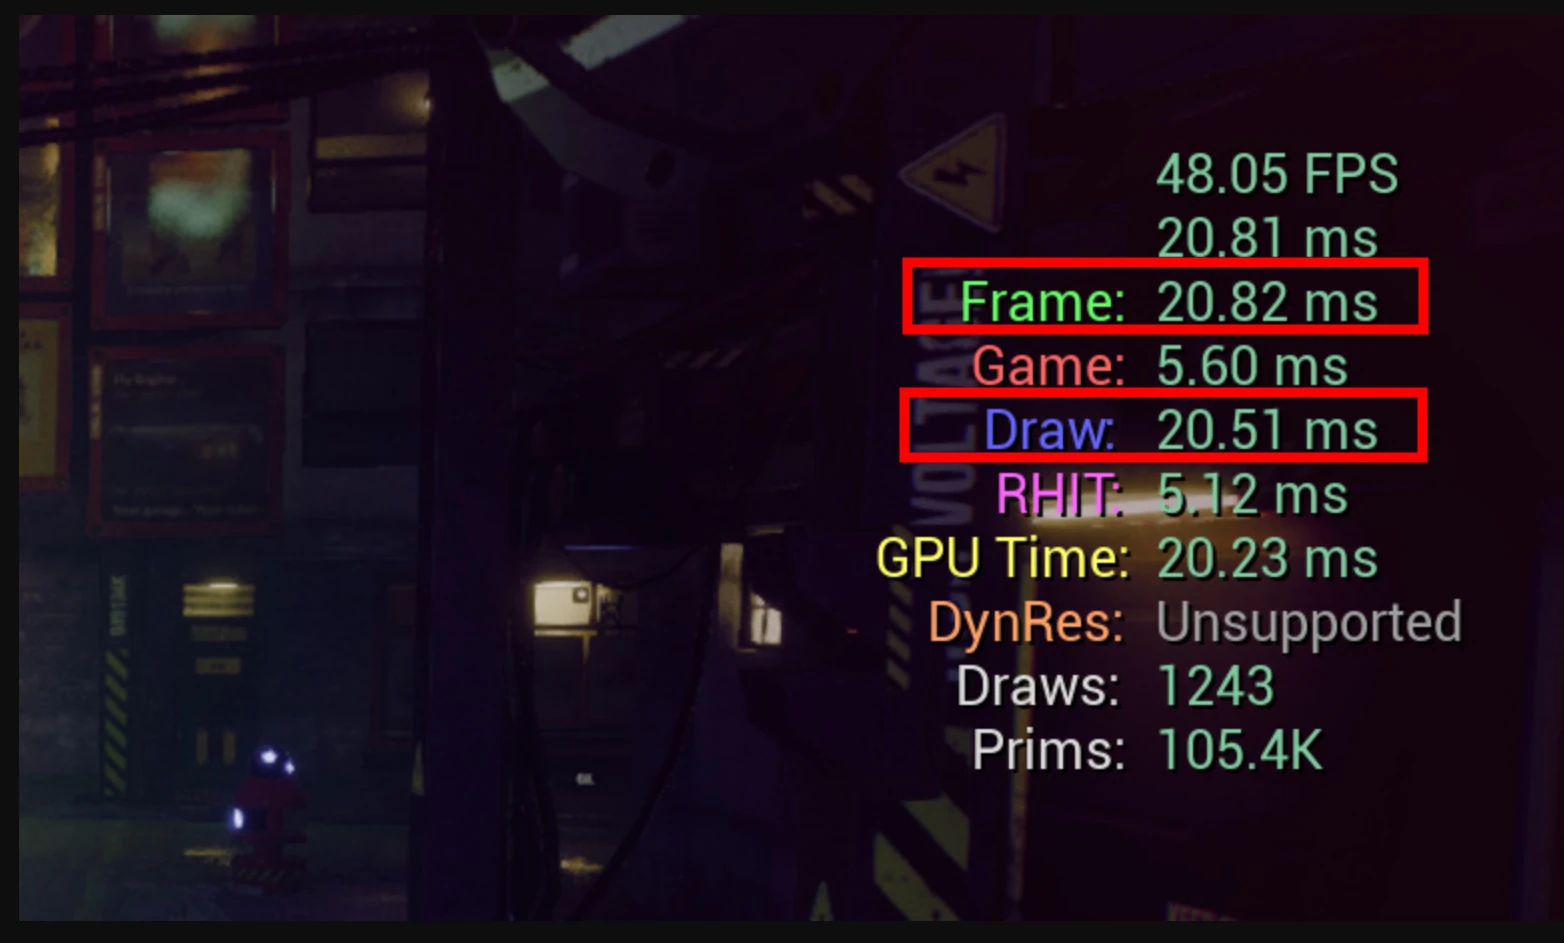
When Frame is close to Draw, the rendering thread is indicated as the bottleneck. It performs the work needed to prepare models, texture mapping, shaders, and other elements for display. If that time is a large share of Frame, rendering-related optimization is needed.
In the image below, Frame and Draw are very close, suggesting that the rendering thread is the bottleneck.
Check GPU time
GPU time measures how long the graphics card takes to render the scene. If it is close to Frame, GPU processing may be the bottleneck.
RHI thread time, RHIT
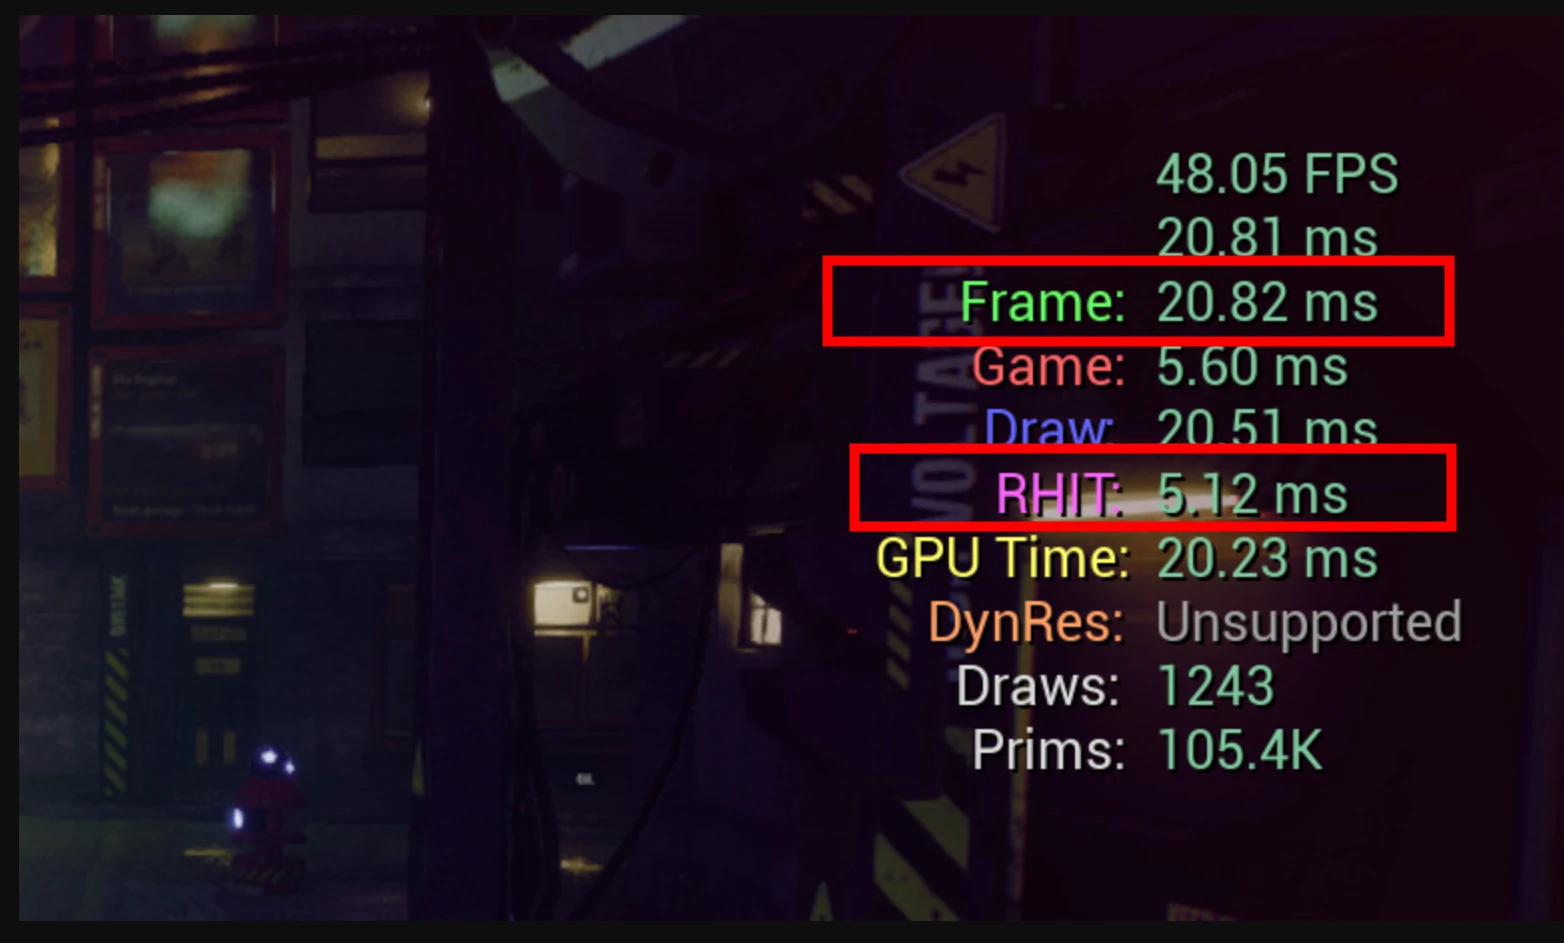
The RHI (Render Hardware Interface) thread communicates with the low-level APIs controlling rendering. A value close to Frame can suggest an issue involving rendering API calls. In the example below, it is not close, so this did not appear to be the problem.
Monitoring dynamic resolution, DynRes
It is disabled here. When enabled, dynamic resolution changes rendering resolution to maintain performance. Whether it is enabled and how it affects the scene are also relevant to performance analysis.
Keeping statistics visible when the editor restarts
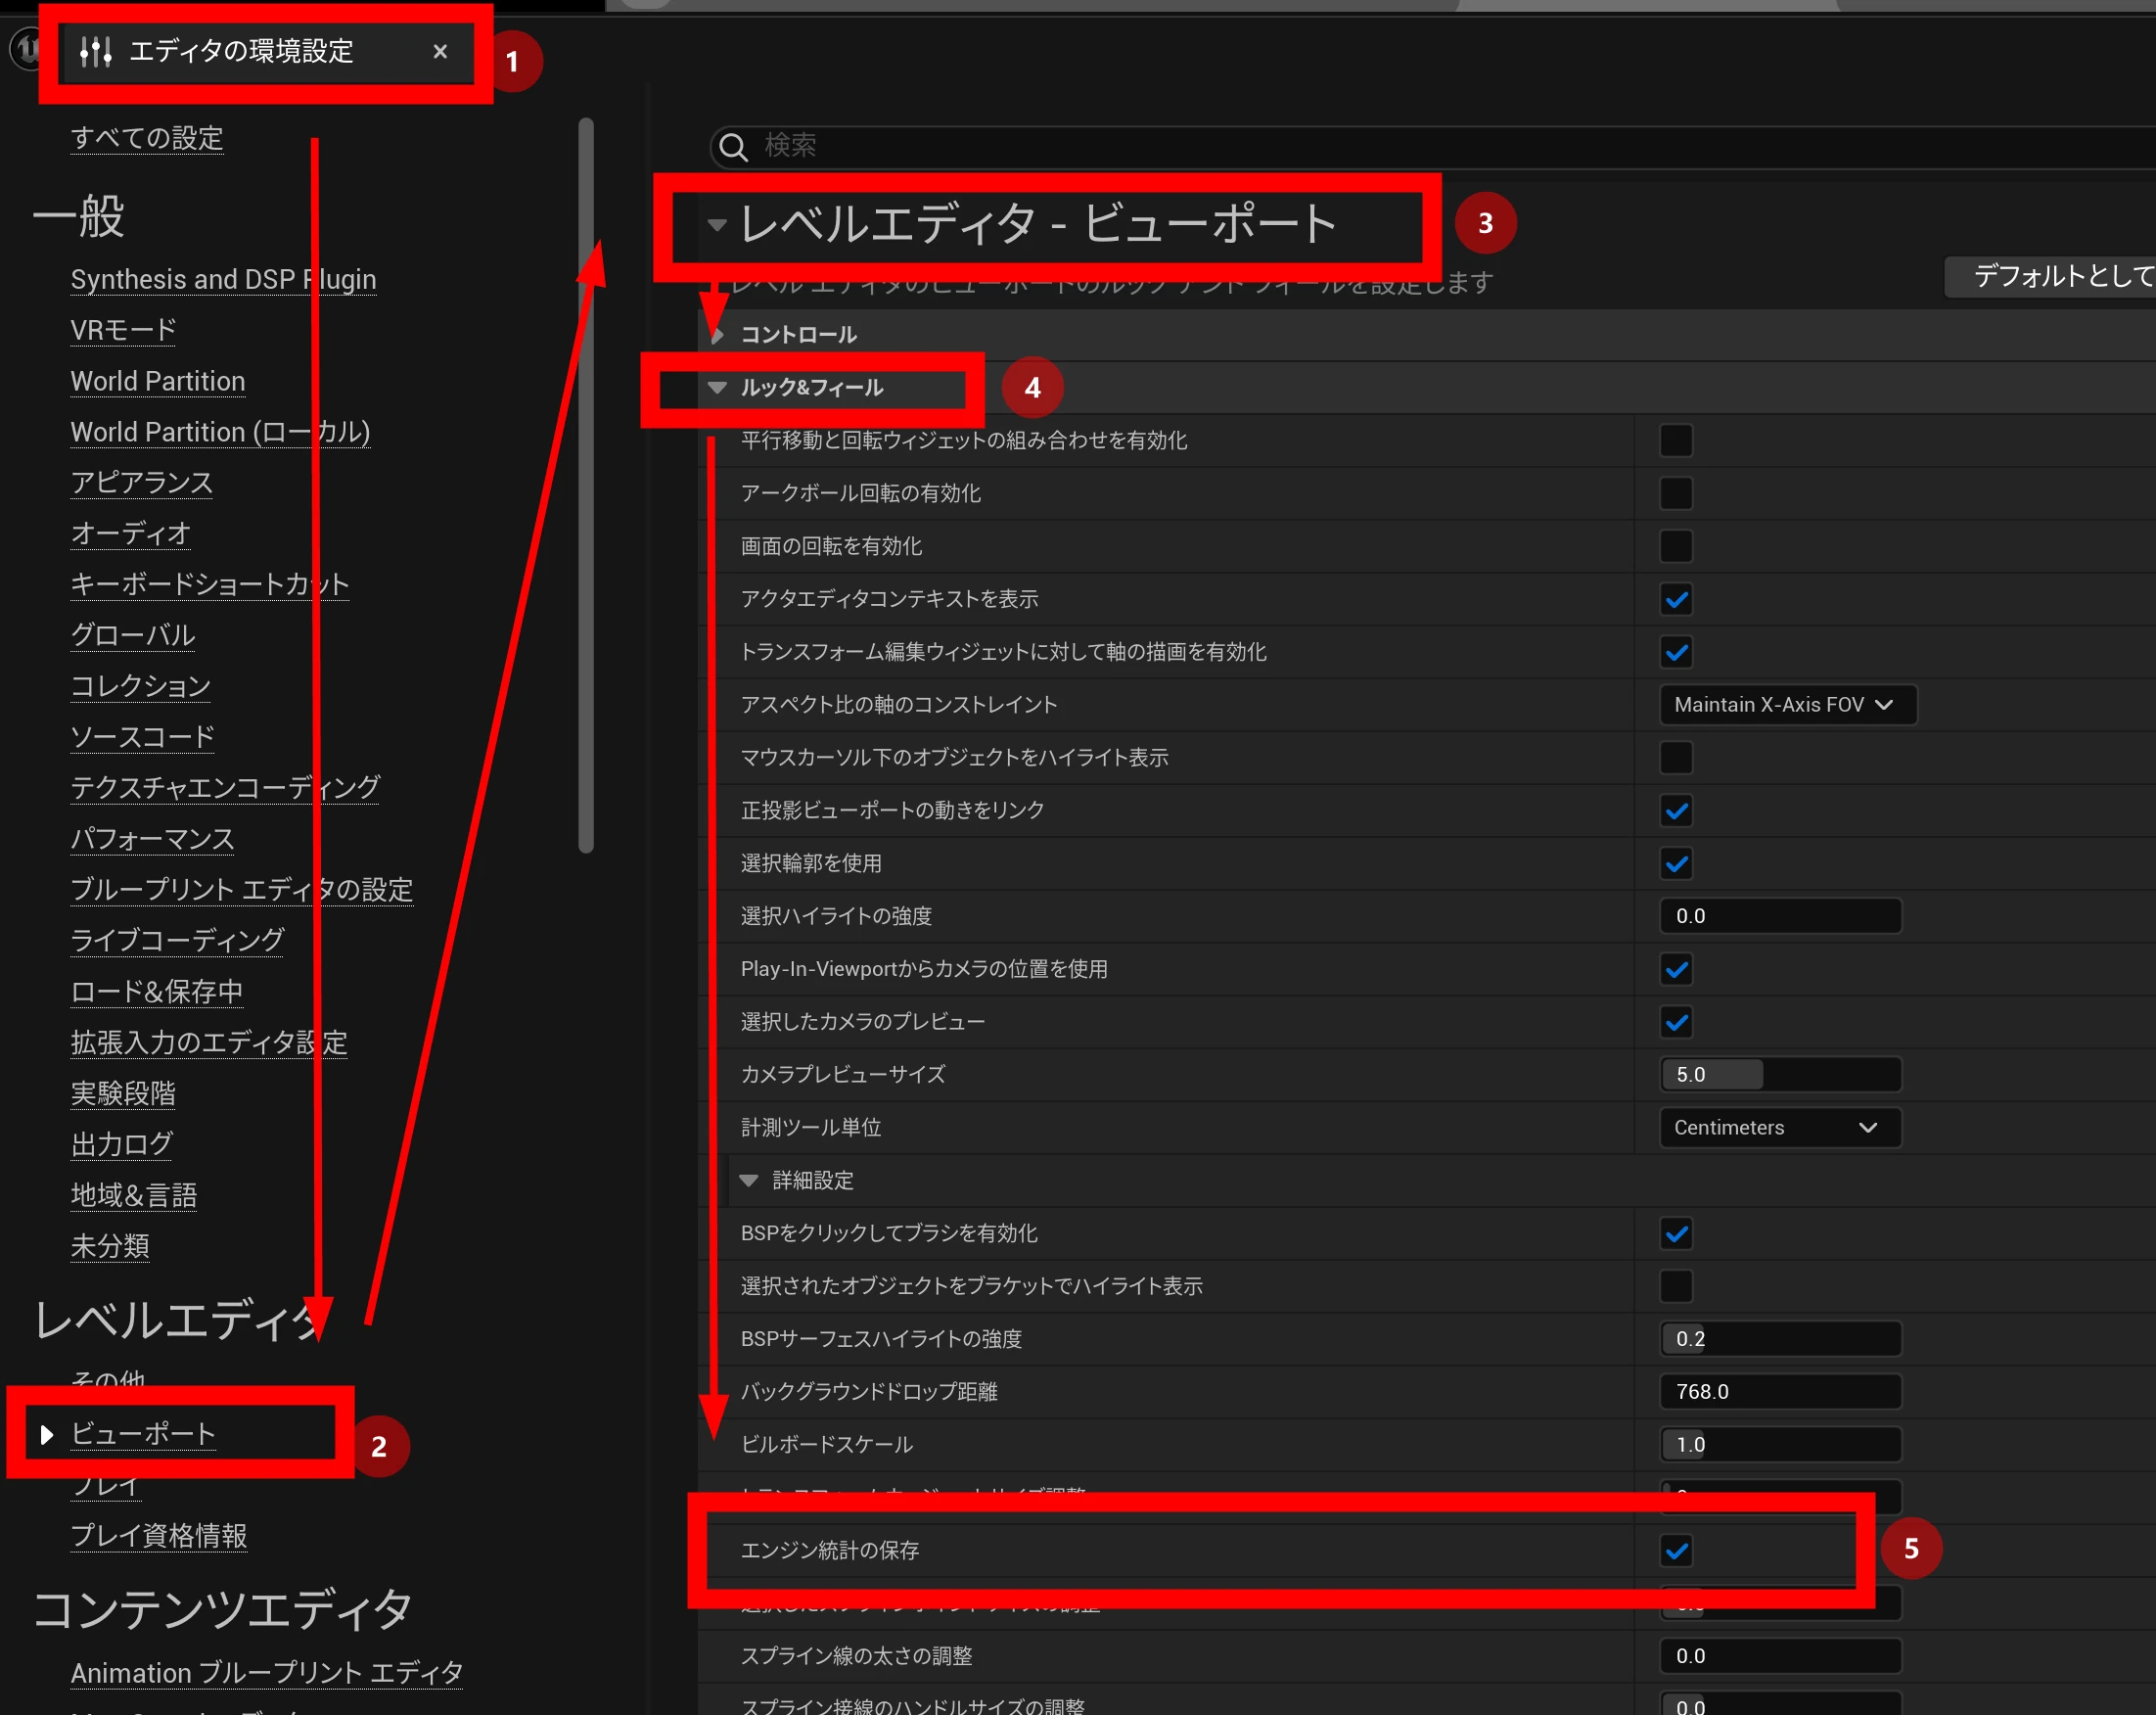
The display disappears when the editor restarts. To retain it, open Editor Preferences → Viewports → Look and Feel and enable saving engine statistics. The statistics then return after restarting the editor.
Checking statistics in an exported, running app
Sometimes you want statistics in the actual exported app, rather than only a simple preview.
Behavior can differ once the application is running.
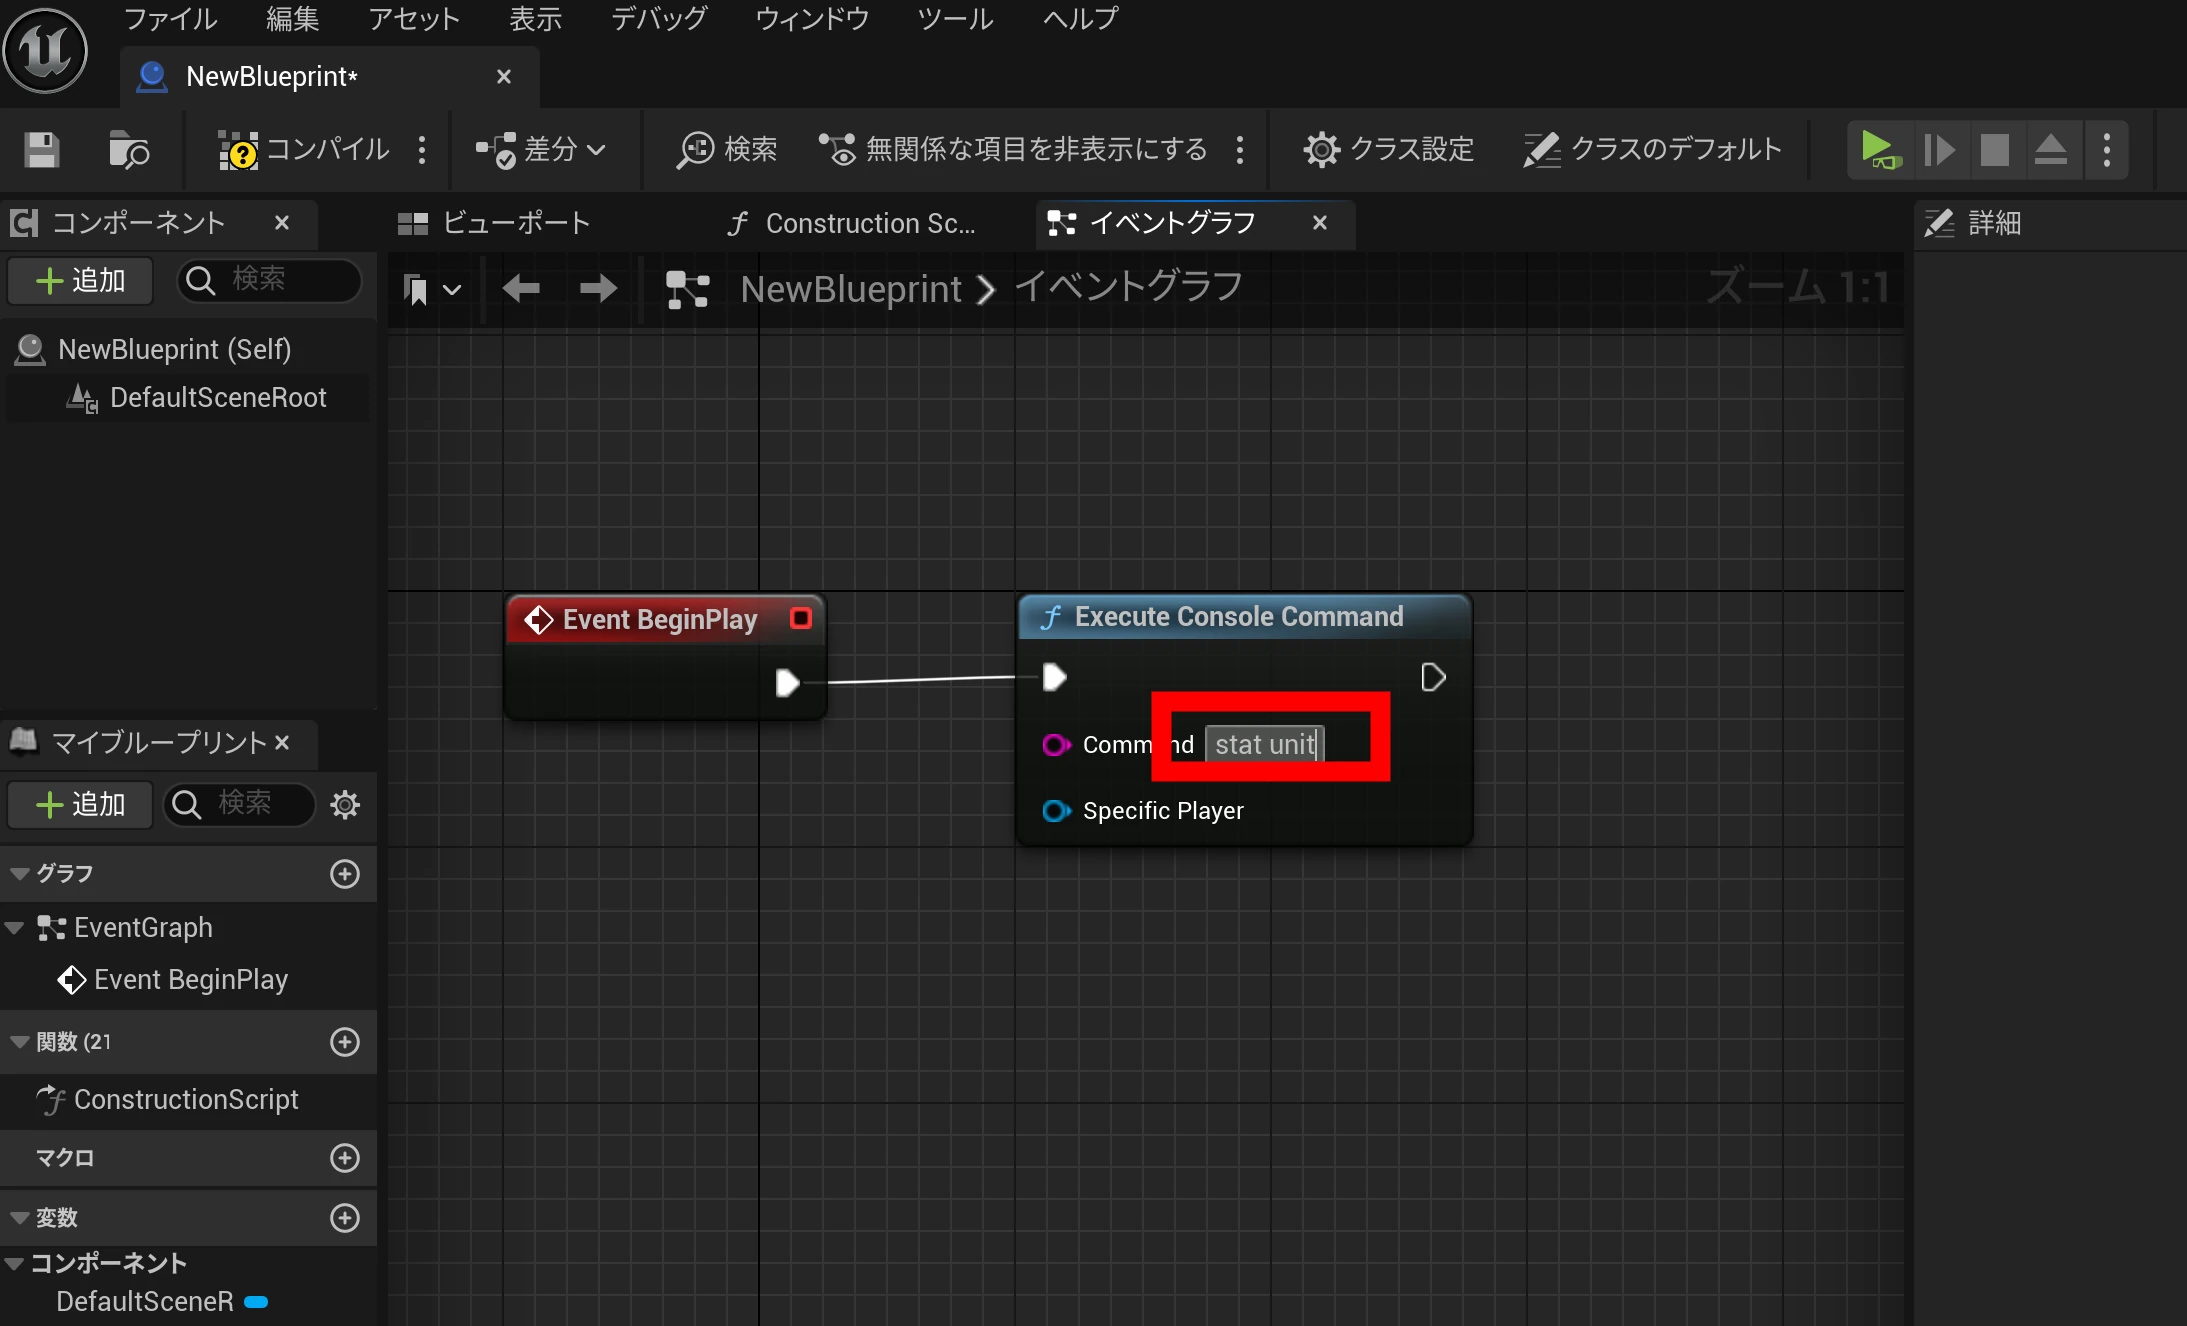
Set up a Blueprint to execute stat unit.
Add Execute Console Command and enter a statistics command such as stat unit.
Riragon's own article ends here. The following section is the result of a deep-search AI query. It may cover points not found above. One benefit of AI search is discovering information you did not know to look for.
Exploring further
The following research examines the detailed interpretation of stat unit, bottleneck identification, and related statistics in UE5. It also covers measurement in packaged apps, VR optimization, hardware effects, and optimization techniques.
Performance measurement and bottleneck analysis in UE5
1. Understanding stat unit fields and identifying bottlenecks
Running the stat unit console command in Unreal Engine 5 displays a breakdown of frame timing. Main fields include Frame, Game, Draw, GPU, RHIT, and Present.
-
Frame: Total time in milliseconds for one frame. It is effectively the largest of the other timings, and corresponds to the inverse of FPS: around 33ms means 30FPS. A Frame time above the target, such as 16.67ms for 60FPS, indicates a bottleneck.
-
Game: Time spent on the game thread, including C++ or Blueprint gameplay code, AI, physics, and other CPU-side logic. If Game is nearly as large as Frame, CPU game-thread work may be limiting the frame rate.
-
Draw: Rendering-thread time, measuring CPU work preparing rendering data and issuing commands. A value close to Frame suggests the CPU's rendering thread is the bottleneck.
-
GPU: Time the GPU spends rendering a frame. The GPU runs asynchronously alongside the CPU, but when a frame's GPU work must finish before display and further progress, a long GPU time extends the total frame time. When Game and Draw are much smaller than Frame but GPU is close to it, the graphics card's workload is the bottleneck.
-
RHIT: Time on the Rendering Hardware Interface thread. This thread, implemented for low-level APIs such as Direct3D12 and Vulkan, submits GPU commands in parallel with the rendering thread. Normally, it is close to or slightly below Frame and is not a major burden without specific expensive work. An extremely high RHIT value may indicate driver processing or waiting for the GPU.
-
Present: Work involved in presenting the image, or time waiting for GPU completion. It may not appear in the
stat unitoverlay itself, but can be measured in detailed statistics such asstat scenerendering. High Present time means the rendering thread is blocked waiting for the GPU and is effectively a GPU-bottleneck symptom. With DirectX, for example, slow GPU work can leave the CPU waiting in Present, increasing frame time.
The longest-running part is the bottleneck.
Actual Frame time is determined by the slowest of Game, Draw, and GPU.
Therefore, the field whose value is nearly equal to Frame identifies the limiting thread or device: CPU game processing, CPU rendering preparation, or the GPU. Optimize that part.
For example, Game 25ms, Draw 5ms, GPU 4ms, and Frame 25ms indicate game logic is limiting the CPU. GPU 30ms, Game 10ms, and Frame 30ms indicate a GPU bottleneck.
2. Related statistics: stat fps, stat gpu, stat scene rendering, and more
Combine stat unit with other Unreal Engine statistics for a more detailed analysis.
-
stat fps: A simple display of current FPS and frame time in milliseconds. It gives an overall indication but does not identify whether the CPU or GPU is responsible. If FPS falls below target, usestat unitto investigate why. -
stat unitgraph: Shows the same Frame, Game, Draw, and GPU timings as a live graph. Running it while moving the camera or traveling through the scene makes spikes easier to spot. A sudden Frame spike compared with gradual load indicates expensive work, or a hitch, at that moment. -
stat sceneRendering: Displays high-level scene-rendering information, including draw calls, rendered primitives or triangles, lighting, and occlusion. It also shows an overall rendering breakdown, including Present time spent waiting for the GPU. Dynamic-light counts and translucent-object costs help locate where the pipeline's load is concentrated. Excessively high Draws can mean too many objects or materials are generating CPU overhead. -
stat gpu: A textual breakdown of GPU processing time. It lists milliseconds per frame spent on passes such as Base Pass, shadow maps, and post-processing. It acts as a simple GPU Visualizer, showing which passes are expensive. If GPU limitation is suspected, identify the dominant pass: high Translucency time, for example, points to translucent-object rendering. Some environments requirer.GPUStatsEnabled 1to use it. -
stat rhi: Shows Rendering Hardware Interface information, including memory used by resources such as render targets and textures, and driver statistics. Render target memory helps show VRAM consumption by G-buffers and shadow maps. It is useful for checking memory-related slowdowns or abnormally high VRAM use.
Together, these commands first show whether the CPU or GPU is limiting performance through stat unit, then help investigate the details.
For example, once a GPU bottleneck is identified, use stat gpu to find the expensive pass. If Game is heavy, use stat game or Unreal Insights to find costly functions in the game code.
Draw-call and lighting information from stat sceneRendering also helps identify scene-design changes, such as reducing object counts or revising lights.
You can also record statistics with stat startfile / stat stopfile and inspect them in Session Frontend or Unreal Insights, as discussed below.
Recording a short period allows later graphing and detailed function-level analysis.
3. Measuring performance and identifying problems in packaged builds
Measuring the actual packaged executable is very important, not just the editor.
The editor has overhead and editor-only work, so execution performance and memory use may differ from a real build.
Memory use and streaming-related stutters can change considerably between editor and packaged execution.
Perform final validation in a packaged build, and confirm that optimizations found in the editor also help there.
Ways to inspect statistics in a packaged build:
-
Use the console in a development build: Choose Development or Debug when packaging to retain runtime console and cheat commands. Open the console with ~, or your configured key, and run
stat unit,stat fps, and similar commands just as in the editor. This provides real-time measurements after packaging. Shipping builds disable the console and stat commands by default, since cheat facilities are removed for production. For performance analysis rather than final product delivery, use Development, or temporarily enable the console through suitableDefaultEngine.inisettings. -
Record a statistics file with
stat startfile: Runstat startfileduring play to record detailed performance statistics untilstat stopfile. The resulting.ue4statsfile is written toSaved/Profiling/UnrealStats/. Open it in the editor's Session Frontend, underWindow → Developer Tools → Session Frontend, or load it in Unreal Insights to analyze detailed CPU/GPU thread profiles. This lets you study packaged-runtime bottlenecks afterward. Unreal Insights, introduced in the later UE4-to-UE5 period, is a powerful profiler that can also attach to a standalone game and collect traces—for example, launch with-trace=cpu,render,gpuand connect from Insights. Recording packaged gameplay lets you return to the editor afterward and investigate the cause. -
Platform-specific tools: These can also help. For Android packages, examples include Systrace and GPU-vendor tools; console platforms provide their own developer tools. They can measure CPU/GPU use, draw calls, and memory. On a typical PC, however, Unreal's stat files and Insights provide ample detail.
What to investigate in packaged execution: Pay attention to differences from editor play.
If FPS suddenly falls only after packaging, possible causes include fullscreen-specific load not present in the editor or features enabled by build settings, such as a different Lumen quality level.
Loading-related stutter also tends to become apparent after packaging.
Assets already loaded in the editor must be read from disk in the packaged environment, making streaming costs directly noticeable.
These storage- or memory-related bottlenecks can be investigated by recording statistics and examining LoadTime and File I/O events, or through logging such as log LogContentPolling and log LogStreaming.
When Frame spikes at a particular moment, inspect nearby file reads and whether garbage collection, or GC, ran at that time.
4. VR bottlenecks and optimization
VR applications require very high frame rates, such as 90 or 120FPS, and low latency, making bottleneck diagnosis even more important than in ordinary games.
An HMD also requires rendering for both eyes, increasing the load.
The following covers VR-specific diagnosis and optimization.
Diagnosing CPU versus GPU limitation: Start as usual with stat unit, checking whether CPU or GPU time has no headroom.
VR tends to be especially susceptible to GPU bottlenecks.
Rendering both eyes at high resolution can require processing a huge number of pixels.
The CPU also has VR-specific overhead, such as draw calls for both eyes and tracking-device updates, but it is less often the limiting factor than the GPU.
In either case, compare Game, Draw, and GPU to see which occupies the frame time.
If GPU is about equal to Frame, it is GPU-limited; a long Game or Draw time points to the CPU.
-
For a GPU bottleneck, inspect
stat gputo find the expensive passes. Distinguish pixel work, such as complex shaders or post-processing, from geometry work, such as too many rendered objects. One diagnostic is to lower resolution drastically: temporarily usevr.PixelDensity 0.5, or around 50% withr.ScreenPercentage. This greatly reduces GPU pixel processing. If FPS rises substantially, the bottleneck likely involves pixel shaders or rendering resolution. If FPS barely changes, geometry or CPU work is more likely dominant. Use that diagnosis to choose the optimizations below.
Main VR optimization points:
-
Reduce draw calls with Instanced Stereo or Multi-View: VR renders the same scene for two eyes, ordinarily doubling draw calls. Instanced Stereo lets the CPU prepare rendering for both eyes together, significantly reducing rendering-thread load. For PC VR, enable it under Engine → Rendering → VR in Project Settings. Mobile VR, such as Oculus Quest, has a similar optimization called Mobile Multi-View. These can shorten Draw time.
-
Use fixed foveated rendering, FFR: Standalone systems such as Oculus Quest can render the area outside the center at lower resolution. UE offers Dynamic Fixed Foveation. Reducing peripheral pixels lowers GPU pixel workload, helping balance quality and performance on devices with limited GPU power.
-
Choose a rendering pipeline: Forward rendering may be preferable in VR. Default deferred rendering is powerful for many dynamic lights and post effects, but VR often prioritizes resolution with minimal dynamic lights, favoring forward shading. Enable Forward Shading in rendering settings and consider MSAA. Default TAA can make blur and ghosting conspicuous in VR, so MSAA may also improve image quality. Forward rendering plus MSAA can simplify rendering while improving clarity.
-
Reduce objects and polygons: Minimize draw calls and keep polygon counts appropriate. Standalone VR can struggle above 100 draw calls; a suggested Quest 2 target is under 100 per frame. Use occlusion and frustum culling to avoid invisible objects, and level streaming or LOD to reduce distant geometry. Where available, Nanite can also help reduce distant polygon work automatically. A suggested Quest 2-class scene target is around 750,000–1,000,000 triangles. Use such targets to check whether your VR content is geometry-heavy.
-
Optimize lighting and post-processing: Avoid dynamic shadows and complex post effects where possible. Bake lighting and minimize dynamic lights; if needed, lower shadow resolution or cascade counts. Bloom, depth of field, and motion blur may add little in VR or worsen motion sickness, so disabling them for performance can be sensible. Reducing these effects frees GPU capacity.
-
Use VR platform tools: SteamVR's Frame Timing graph distinguishes application-side delays from compositor-side delays. On Oculus devices, OVR Metrics Tool displays CPU/GPU usage and thermal information on the HMD. Combine platform tools with UE's stat commands to keep monitoring which part lacks headroom.
5. Hardware factors and their bottleneck symptoms
Bottlenecks can broadly originate in the CPU, GPU, memory, or storage. Typical symptoms and diagnostic methods follow.
-
CPU bottleneck: The game or rendering thread limits FPS. In
stat unit, Game or Draw is about equal to Frame. Common causes include game logic such as AI or many events, physics, animation updates, and collision checks for too many objects. Usestat gamefor a game-thread breakdown orstat physicsfor physics-engine update time. If the game thread itself is at fault, take a detailed CPU profile in Unreal Insights or a short function trace withprofilegame, looking for functions such as expensive per-frame Blueprint Tick work. If Draw is heavy, review draw calls, occlusion, and batching. Responses include reducing calculations, parallelizing work, removing unnecessary Tick, replacing Blueprint work with C++, and reducing draw calls. -
GPU bottleneck: GPU rendering limits FPS, with GPU close to Frame. Typical causes include excessive geometry, large rendering areas and pixel counts, complex materials or shaders, overdraw, expensive effects, high-resolution textures, post-processing, and excessive particles. Use
stat gpuor the GPU Profiler visualizer, opened withCtrl+Shift+,, to inspect passes. A dominant BasePass may suggest geometry load, while high PostProcessing points to post effects. Test lower quality: if reducing textures, lighting, or resolution improves FPS, excessive GPU load is implicated. Reduce polygons or draw calls, optimize shaders, disable unnecessary effects, and reconsider resolution and quality. -
Memory bottleneck: RAM or VRAM capacity or bandwidth is insufficient. Capacity shortages rarely present only as consistently low FPS; they often cause intermittent stutter or GC-related drops. Brief periodic hitches may involve heap allocation or garbage collection. Monitor
stat memoryor usememreport -fullto identify the resources consuming memory. Full VRAM can prevent texture streaming from keeping up, reducing quality or causing swapping. Check logs for warnings such as "Texture pool size exceeded" and consider increasingr.Streaming.PoolSizeor reducing texture sizes.stat rhihelps inspect current VRAM use. Since these problems often appear as irregular hitches rather than a direct constant FPS reduction, examine Memory and Loading traces according to the symptoms. -
Storage/I/O bottleneck: HDD or SSD read speed causes stalls, usually during loading rather than as consistently low FPS. Open worlds streaming many assets may briefly freeze when disk I/O cannot keep up. Enable the File trace in Unreal Insights and inspect reads around the affected frame. Logging
LogStreamingat Verbose or above can expose slow loads too. Possible responses include preloading data through a loading screen or earlierLoadLevelStreaming, reducing streamed-object counts, and reducing compression to lower decompression cost. Fast storage such as NVMe SSDs has made storage-limited rendering less common; some say a normal SSD rarely becomes the bottleneck. Slow HDDs or exceptionally large datasets still warrant attention, including upgrading to SSD where necessary.
6. Effective optimization techniques
Once the bottleneck is identified, optimize the relevant work. Broad categories are engine settings, assets/content, and code/algorithms.
-
Review engine and rendering settings: Disable unnecessary expensive features and choose suitable quality. In UE5, disabling Lumen global illumination in favor of screen-space GI, or turning off unused hardware ray tracing, can substantially reduce load. For profiling, disable VSync and Smooth Frame Rate so the engine does not automatically constrain timing. Lower shadow and post-process quality to reduce GPU load. Reconsider unnecessarily high resolution and anti-aliasing too. Match scalability settings such as Epic, High, or Medium to the target hardware, keeping quality within the target-FPS budget for stability.
-
Optimize assets, LOD, polygons, and textures: Give high-polygon models levels of detail, LOD, to reduce polygons with distance. Rendering full detail far away is wasteful; use automatic LOD generation or a simplifier. Hierarchical LOD, HLOD, and instancing can group content and reduce render workload and draw calls. Reduce oversized textures or adjust compression to lower memory and bandwidth use. Stripping unused mipmaps can help on mobile and VR. Remove or simplify unnecessary translucent materials and excessive particles: transparency is expensive because of ordering and overdraw, so keep it to a minimum.
-
Reduce object counts and draw calls: To reduce CPU rendering load, combine small objects instead of drawing each separately. Static background objects can be merged into a static mesh in a DCC tool to render in one draw call. UE has automatic batching for meshes sharing materials, but enormous object counts still have limits. HLOD can replace distant buildings and similar groups with simplified combined meshes. For many moving objects, consider instancing or Instanced Static Mesh components. Holding dozens or hundreds of similar meshes as one actor's instance array, instead of separate actors, can sharply reduce draw calls.
-
Cull invisible objects: Avoid drawing objects outside the camera view. The engine performs frustum and occlusion culling by default, but a level may still contain many objects behind the camera. Use Cull Distance Volume to hide small distant objects, or set
PrimitiveComponent'sMinDrawDistanceandMaxDrawDistance. Where portals or obstructions permit, manually designed view blockers can prevent rendering another area and improve performance. -
Optimize lighting: Prefer static lighting and baked lightmaps, reducing dynamic shadows where possible. If dynamic light is necessary, lower shadow resolution or update frequency. Make only nearby necessary lights movable, keep others static, or restrict shadow-casting objects. Use distance-based shadow fade, including distant cascade fading. Reflections are also expensive: tune Planar Reflection resolution and consider static rather than real-time Sky Light updates. Build lighting properly and optimize Lightmap UVs and resolution to reduce memory and rendering load.
-
Reduce post effects: Depth of field, motion blur, bloom, lens flare, screen-space reflections (SSR), and screen-space ambient occlusion (SSAO) can add substantial GPU cost. Consider disabling effects that do not materially improve the scene. In VR or a tight performance budget, this alone may save several milliseconds. For essential effects, reduce quality—for example, lower-quality SSR or fewer motion-blur samples.
-
Optimize Blueprint and code: First remove or suppress unnecessary work executed every frame. Review whether each actor truly needs Tick, and whether updates can run less frequently, such as on a 0.1-second timer. Blueprint adds overhead compared with C++, so frequently called logic can benefit from a C++ implementation or Blueprint Nativization. Rewriting expensive arithmetic or loops can make a substantial difference. UE also offers multithreaded tasks, such as AsyncTask and parallel foreach, so consider distributing work asynchronously instead of doing everything on the game thread. Tune physics and collisions by reducing rigid bodies, lowering collision-check frequency, and defining collision channels to avoid unnecessary tests. For animation, avoid updating unnecessary bones through options such as MasterPoseComponent and Update Rate Optimizations, and avoid ticking complex skeletal meshes when off-screen.
-
Other techniques: A Significance Manager can slow updates for distant or off-screen actors. Level streaming can split large maps and load only necessary regions. Compression such as Oodle can shorten loading; particle effects can use LOD and culling distances. The list goes on. The key is prioritizing changes directly related to bottlenecks demonstrated by profiling. Profile again after optimization to verify the effect. Repeat the measure–improve–verify cycle, building up gains until the target is reached.
This section has covered interpreting stat unit, combining related statistics, measuring packaged builds, VR considerations, hardware diagnosis, and optimization techniques.
Correctly identifying bottlenecks and choosing appropriate responses should improve and stabilize frame rates.
Choose techniques appropriate to your project's scale and target platform, working toward a comfortable user experience.
Tools such as Unreal Insights and the stat commands help analyze and address the limiting work, which is central to producing high-performance UE5 content.
References: Epic Games' official documentation and community forums; the Unreal Engine performance guide; community technical writing; and the Outer Space forum discussion of AMD's Unreal Engine 4-specific patch, among others.
Related articles
Updates and contact: X @riragoncom.